Publication > Research Gallery > Cosmology
Research Gallery
Cosmology
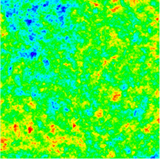 |
Excessive shift of the CMB acoustic peaks of the Cold Spot area Measurement of the acoustic peaks of the full-sky cosmic microwave background (CMB) temperature anisotropies has been instrumental in deciding the geometry and content of the universe, e.g. the first acoustic ...(more) |
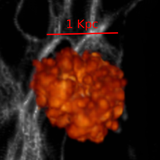 |
Chemical Enrichment of the First Supernovae Metallicity distribution after the first supernova explosion. The metal-rich ejecta has been dispersed to ~ 1 kpc and polluted the pristine IGM gas at 20 Myr after the explosion. ...(more) |
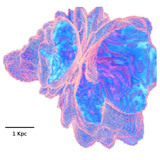 |
The HII region around the first star Cosmological simulations suggest that the first stars were very massive. They could emit a large amount of UV radiation and create extensive HII regions. ...(more) |
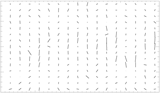 |
Estimated beam of WMAP Q1 Differencing Assembly Map in Ecliptic Coordinate Estimation of the effective inflight beam of WMAP Q1 Differencing Assembly in Ecliptic Coordinate. The bar denotes the asymmetry R= r_maj /r_min -1, where r_maj and r_min are the major ...(more) |
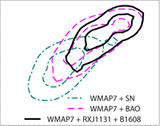 |
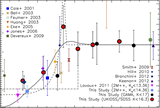
Cosmological constraints from gravitational lens time delays Posterior probability distribution function of H0, Ωde, w, and Ωk for supernovae (SN; turquoise dot-dashed; Hicken et al. 2009), baryon acoustic oscillation (BAO; magenta dashed; Percival et al. 2010), time-delay ...(more) |
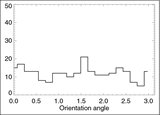 |
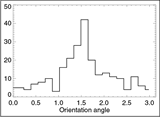
Histogram of the estimated beam orientation of WMAP Internal Linear Combination Map in Ecliptic Coordinate Histogram of the estimated beam orientation of WMAP Internal Linear Combination Map in Ecliptic Coordinate. The angle is defined with that between the bar and the Ecliptic Equator. ...(more) |
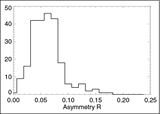 |
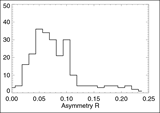
Histogram of the estimated beam asymmetry of WMAP Internal Linear Combination Map The histogram of the estimated beam asymmetry R= r_maj /r_min -1 of WMAP Internal Linear Combination Map, where r_maj and r_min are the major and minor axis of the elliptical ...(more) |
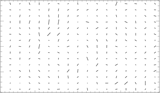 |
Estimated beam of WMAP Internal Linear Combination Map in Ecliptic Coordinate Estimation of the effective inflight beam of WMAP Internal Linear Combination in Ecliptic Coordinate. The bar denotes the asymmetry R= r_maj /r_min -1, where r_maj and r_min are the major ...(more) |
 |
Histogram of the estimated beam orientation of WMAP Q1 Differencing Assembly Map in Ecliptic Coordinate Histogram of the estimated beam orientation of WMAP Q1 Differencing Assembly Map in Ecliptic Coordinate. The angle is defined with that between the major axis and the Ecliptic Equator. ...(more) |
 |
Histogram of the estimated beam asymmetry of WMAP Q1 Differencing Assembly Map The histogram of the estimated beam asymmetry R= r_maj /r_min -1 of WMAP Q1 Differencing Assembly Map, where r_maj and r_min are the major and minor axis of the elliptical ...(more) |
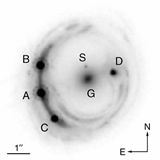 |
Strong gravitational lens system with time delays Image of the gravitational lens RXJ1131−1231, taken with the Advanced Camera for Surveys on the Hubble Space Telescope. The lensed AGN images of the spiral source galaxy are marked by ...(more) |
 |
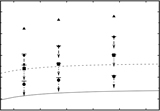
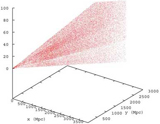
Evidence for a 300 Mpc Radius Local Under-density Near-infrared K-band (2.2 micron) luminosity density as a function of comoving distance in the local universe. Data points show measurements from this study and others from the literature. The right ...(more) |
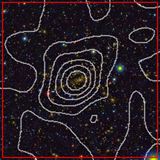 |
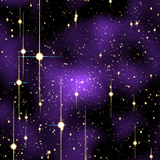
Mass Distribution in and around the Galaxy Cluster MACS J1206.2-0847 Subaru BVRIz composite color images centered on the galaxy cluster MACS1206 (z=0.439), overlaid with mass contours from our joint strong-and-weak lensing analysis of HST and Subaru observations. The image size ...(more) |
 |
21cm brightness fluctuation at z=0.8 in cross-correlation Three-dimensional cross power spectrum of the 21cm emission measured at the Green Bank Telescope and the optical density field traced by the WiggleZ redshift survey. Negative points are shown with ...(more) |
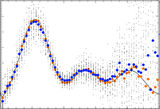 |
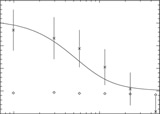
Direct measurement of the angular power spectrum of cosmic microwave background temperature anisotropies in the WMAP Data Direct measurement of the CMB angular power spectrum. From WMAP V band map we choose patches with σ < 98 μK (after eliminating bright point sources), and we take the ...(more) |
 |
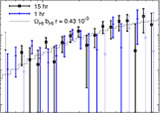
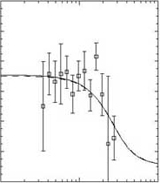
The GMRT Epoch of Reionization experiment: a new upper limit on the neutral hydrogen power spectrum at z ≈ 8.6 Average power spectrum in units of K 2 of all combinations of days, excluding December 11, as a function of the multipole moment l. Each point is shown with a ...(more) |
 |
An intensity map of hydrogen 21-cm emission at redshift z ≈ 0.8 A cross-correlation measurement of 21-cm emission measured by the Green Bank Telescope, and the optical galaxies measured by the DEEP2 galaxy survey. ...(more) |
 |
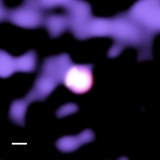
Direct measurement of dark matter halo ellipticity of massive clusters A Subaru Suprime-Cam image of one of the clusters used in the analysis, A2390, (2.7 billion light years from the Earth). The purple hue shows the dark matter distribution measured ...(more) |
 |
Correlation between the temperature of the intra-cluster medium of galaxy cluster A1689 and its surrounding environment of the large-scale-structure. Maps of the large-scale structure of galaxies (purple) and gas temperature distributions within the cluster (pink). Brighter pink indicates higher temperature. The filamentary structure is found outside the cluster in ...(more) |
 |
Full mass profiles of five massive galaxy clusters Model-free direct reconstruction of full mass profiles for five massive galaxy clusters, A1689, A1703, A370, Cl0024+17, and RXJ1347-11, from combined weak and strong gravitational lensing. ...(more) |
 |
Joint constraints on the DM halo structure parameters from full lensing analysis (CL0024+1654) Joint constraints on the dark-matter halo structure parameters of the galaxy cluster CL0024+1654 (z=0.395) from full lensing analysis of Subaru weak lensing and ACS strong lensing data (Umetsu et al. ...(more) |
 |
Three-dimensional galaxy distribution for about 1/10 field of view of the RCS photometric redshift catalog The figure represents the three-dimensional galaxy distribution for about 1/10 field of view of the RCS photometric redshift catalog (Hsieh et al. 2005, ApJS, 158, 161; Gladders and Yee 2005, ...(more) |
 |
Quadrupole power spectra for the 2dF QSO redshift survey Quadrupole power spectra for the 2dF QSO redshift survey measured with our algorithm. Anisotropic nature due to the redshift-space distortions can be seen although it is noisy (Yamamoto, Nakamichi, Kamino, ...(more) |
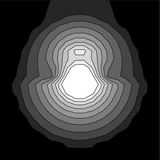 |
Sunyaev-Zel'dovich effect as a probe for large structures in the Universe The Sunyaev-Zel'dovich effect as a probe for large structures in the Universe. Top: integrated pressure contour map showing a signature of merger. Left: comparison between thermal and non-thermal spectral functions ...(more) |