
成果發表 > 研究成果藝廊 > 星際與拱星介質
研究成果藝廊
星際與拱星介質
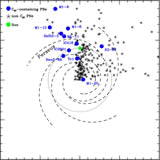 |
The location of the C60 containing Planetary Nebulae (blue symbols) in the Milky Way The location of the Sun is given by a green circle, and the dotted line shows the Solar Circle, e.g. the circle that connects all points with the same distance ...(more) |
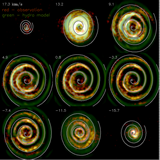 |
Evidence of a Binary-Induced Spiral from an Incomplete Ring Pattern of CIT 6 Velocity channel images of an HC3N molecular line emission of CIT 6 observed with the VLA (red, Claussen et al. 2011), and modeled by an hydrodynamic radiative transfer simulation using ...(more) |
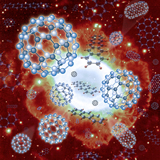 |
Artist impression of fullerenes in front of a planetary nebulae. Artist impression of fullerenes in front of a planetary nebulae. ...(more) |
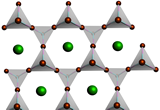 |
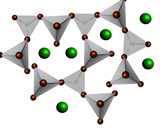
lattice structure of crystalline silicate lattice structure of crystalline silicate ...(more) |
 |
lattice structure of amorphous silicate lattice structure of amorphous silicate ...(more) |
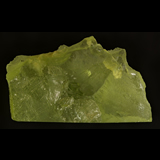 |
crystalline silicates (1) crystalline silicates ...(more) |
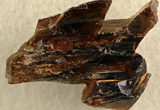 |
crystalline silicates (2) crystalline silicates ...(more) |
 |
The evolution of dust abundance The evolution of dust abundance relative to the total gas content calculated by the theoretical models developed by Kuo & Hirashita (2012, MNRAS, 432, 637). The horizontal axis shows the ...(more) |
 |
Evolution of dust abundance The evolution of dust abundance relative to the total gas content calculated by the theoretical models developed by Tzu-Ming Kuo and me (Kuo & Hirashita 2012, MNRAS, 432, 637). The ...(more) |
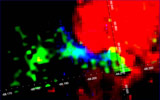 |
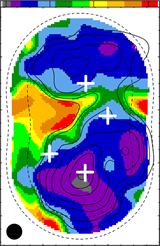
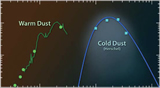
Distribution of molecular hydrogen, PAH and Halpha emissions in a photodissociation region in the LMC Molecular hydrogen (green), PAH (blue) and Halpha (red) emissions toward a photodissociation region (3.2'X 5.4') in the LMC. The region show H2 excitation temperature 107.6+/-7.6 K, column density 5.86e+19 and ...(more) |
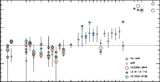 |
Chemical abundances in hot subdwarf B stars Elemental abundances for hot subdwarf stars relative to solar values. Abundances for helium-rich subdwarfs and helium deficient normal subdwarfs are indicated by a mean (symbol) and range (line). The most ...(more) |
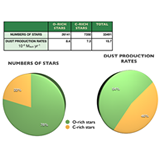 |
The Dust Input from Evolved Stars to The Magellanic Clouds Evolved-star dust production rates for the Large Magellanic Cloud from Riebel, Srinivasan, Sargent et al. (2012) ...(more) |
 |
Map of the abundance of the CS molecule Map of the abundance of the CS molecule from the combined Berkley Illinois Maryland Association (BIMA) interferometer and the Five College Radio Astronomy Observatory (FCRAO) 14m telescope observations, overlapped with ...(more) |
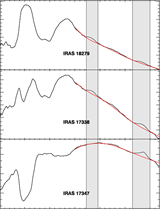 |
Crystallization of circumstellar silicates Three infrared spectra taken by the Spitzer Space Telescope, showing the characteristic features of amorphous (at 10 and 18 micron) and crystalline (at 23, 28 and 33 micron) silicates seen ...(more) |
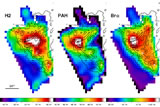 |
Molecular hydrogen, PAH, and Bralpha line maps of SNR N49 in the Large Magellanic Cloud H2 1–0 O(3), PAH, and Brα line maps of N49 by using the AKARI/IRC spectra. For comparison, contours (black) are taken from an Hα image of the HST/WFPC2 (Bilikova et ...(more) |
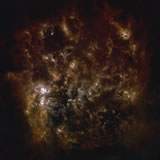 |
Three color image of the Large Magellanic Cloud, taken with the Herschel space telescope From blue to red, the colors represent filters centered at 100, 160 and 250 micron. Extended emission at these wavelengths are due to thermal emission from dust. The bright region ...(more) |
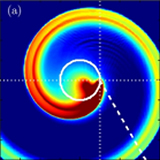 |
Spiral density patterns calculated for the interaction between a dense stellar wind and a planet or brown dwarf orbiting the mass-losing star The three panels show the results for three different wind speeds: 0, 5 and 10 Mach, with Mach the number of times the local sound speed is exceeded. The circle ...(more) |
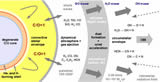 |
Schematic chemical structure of the circumstellar shell of an AGB star The top half of the plot represents the chemistry in an oxygen-rich environment (C/O < 1), and the bottom half of the figure shows the carbon-rich counterpart. ...(more) |
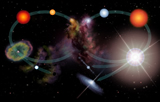 |
The life cycle of dust in the interstellar medium of a galaxy Stars form the molecular cloud (center) and develop either as a high-mass (right) or a low-mass star (left). ...(more) |
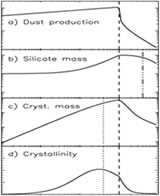 |
The crystalline fraction of interstellar silicates in starburst galaxies The top panel indicates the total dust production in a starburst galaxy in terms of time after the start of the starburst; the star formation rate is constant and the ...(more) |
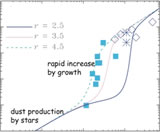 |
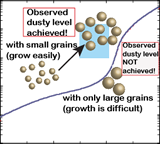
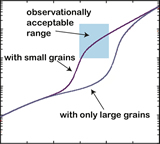
Effects of grain size distribution on the interstellar dust mass growth The figure above demonstrates how the dust-to-gas ratio in a galaxy evolves with increasing metallicity. In the low-metallicity regime, the dust is predominantly supplied by stars, so the dust-to-gas ratio ...(more) |
 |
Herschel Detects a Massive Dust Reservoir in Supernova 1987A The infrared emission from supernova 1987A in the form of a spectral energy distribution. The green points and line show observations obtained with the Spitzer Space Telescope, tracing the amount ...(more) |
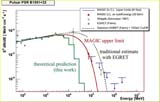 |
Spectral energy distribution of pulsed emission from a middle-aged pulsar B1951+32 Spectral energy distribution of pulsed emission from a middle-aged pulsar B1951+32. The abscissa denotes photon energies in Million electron volts (MeV), while the ordinate denotes photon energy fluxes. The green ...(more) |
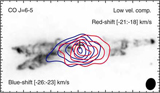 |
CO(6-5) line at 690 GHz of the proto-planetary nebula CRL 618 The CO(6-5) line at 690 GHz of the proto-planetary nebula CRL 618 is first detected and imaged by the SMA. CRL 618 exhibits two different kinematical components, which are interpreted ...(more) |
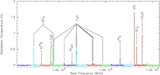 |
Spectrum centered around 143 GHz of carbon star CW Leo Spectrum centered around 143 GHz of carbon star CW Leo. Identification is shown for strong emission lines. The data were taken using Arizona Radio Observatory 12m telescope. (He et al. ...(more) |
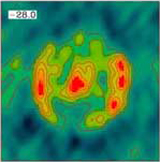 |
CO(2-1) emission from carbon star R Scl CO(2-1) emission from carbon star R Scl imaged with the SMA. A clumpy shell is clearly seen in all velocity channels. The shell has a dynamical timescale of ~1600 years. ...(more) |