Research Gallery > Star Formation Studies
Research Gallery
Star Formation Studies
| A study of the wiggle morphology of HH 211 through numerical simulations |
|
Image Credit: Anthony Moraghan, Chin-Fei Lee, Po-Sheng Huang, Bhargav Vaidya
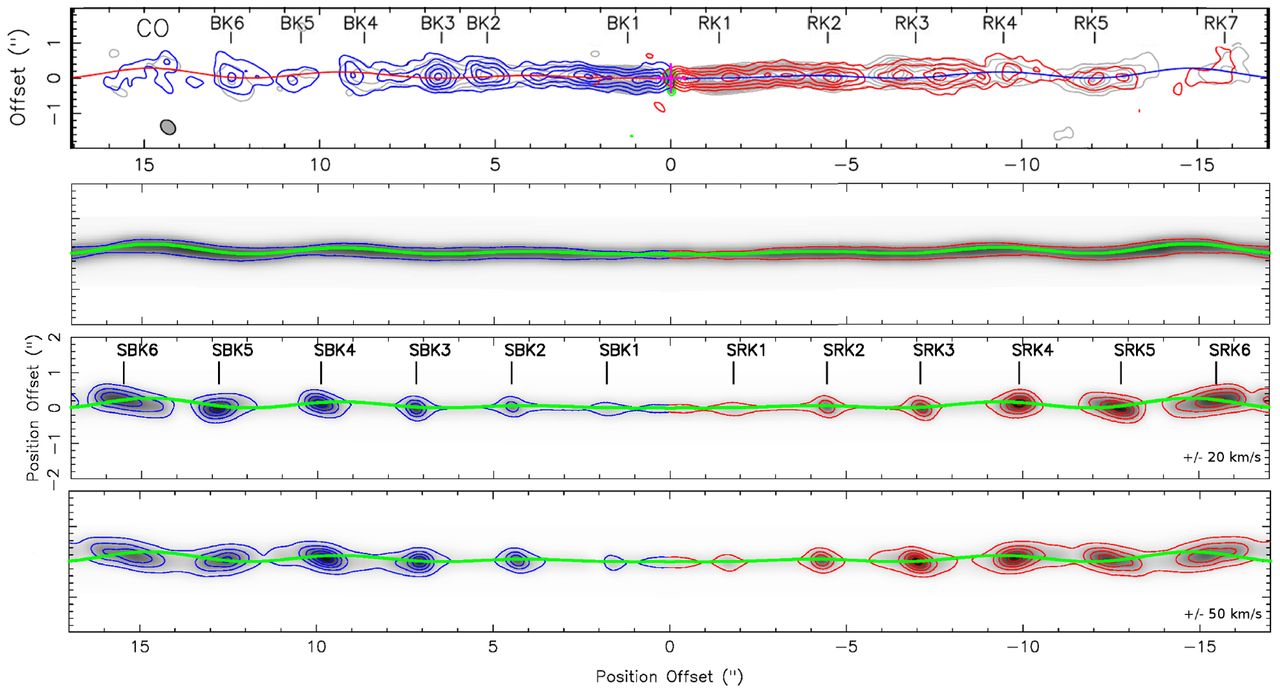
Top panel: a reproduction of fig. 1(b) from Lee et al. (2010) showing the CO emission integrated intensity map of HH 211 within 17 arcsec from the source. The red and blue contours highlight the redshifted and blueshifted components integrated from 20 to 43 km/s and −16 to 0 km/s, respectively, where the contours begin at 0.56 Jy/beam km/s and step at intervals of 0.84 Jy/beam km/s. The location of the blueshifted and redshifted knots are labelled. The red and blue lines trace the wiggle produced by the analytical model.
Second panel: simulated synthetic CO emission map for the steady velocity jet simulation. For a direct comparison to the observation, it uses the same channel map velocity range and contour intensity values. The green line traces the analytical model wiggle. This shows that the assumption of the jet source in a binary system can indeed reproduce the reflection symmetric wiggle.
Third panel: simulated synthetic CO emission map of the 170 ± 20 km/s pulsed jet simulation. Again the channel map velocity range and contour intensity values are the same as the observational image and the green line traces the analytical model wiggle. We see that whereas the observational map has intense jet emission near the jet source, the simulated map has weaker emission near the source. Also, the positions of the knots are not precisely aligned with the positions of the observational knots, especially in the blueshifted side. However, the intensity range of the simulated knots are similar to the observational knots.
Fourth panel: similar to the third panel, but for the 170 ± 50 km/s pulsed jet simulation. Note, the displayed time is at an earlier phase of evolution. It is two rotation periods before that of the 170 ± 20 km/s jet in the third panel. This may account for increase of intensity of the outer knots as they are closer to the leading bow shock. However, it shows a high amplitude of velocity perturbation cannot increase the intensity of emission near the source in our model.
|