
研究成果藝廊 > 行星科學
研究成果藝廊
行星科學
| Diffusion map around the small moon Aegaeon (Saturn LIII). |
|
圖片來源: M. A. Muñoz-Gutiérrez
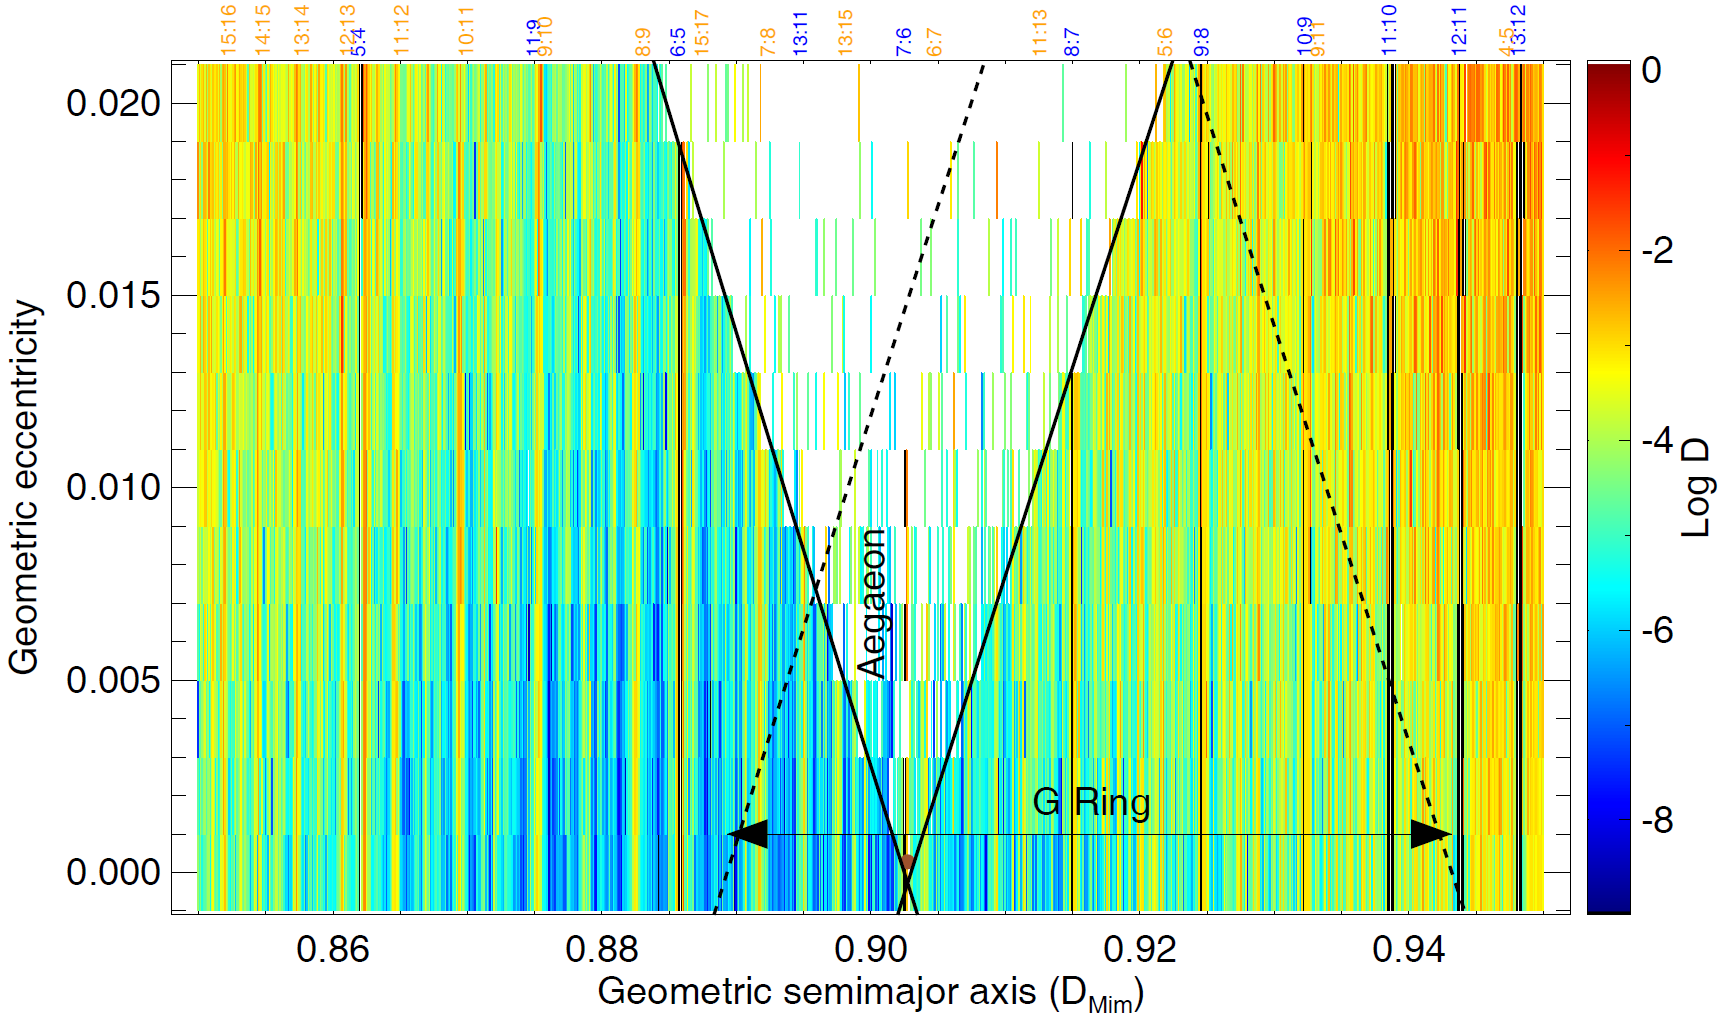
Diffusion is computed after a frequency analysis of thousands of test particles. Bluer colors are for stable orbits, redder colors indicate unstable ones.
|
| The location of Aegaeon is indicated by a brown circle. Solid black lines stand for the pericentric and apocentric distances of particles at the apocentre and pericentre distances of Aegaeon, respectively. Most particles inside this region collide with Aegaeon; however, some particles survived, mainly those with the smaller eccentricity. Resonant particles in first-order MMRs with Mimas are colored in black. Labels for first- and second-order MMR ratios are shown at the top of the figure to indicate the location of the respective resonance. Blue labels are for resonances with Mimas, orange ones for resonances with Janus. Black dashed lines mark the position of constant pericentric and apocentric distances of particles, at the position of the inner and outer G ring edges, respectively. All particles inside this region are assumed to form part of the G ring. |