
研究成果藝廊 > 星際與拱星介質
研究成果藝廊
星際與拱星介質
| Evolution of dust abundance |
|
圖片來源: Hiroyuki Hirashita
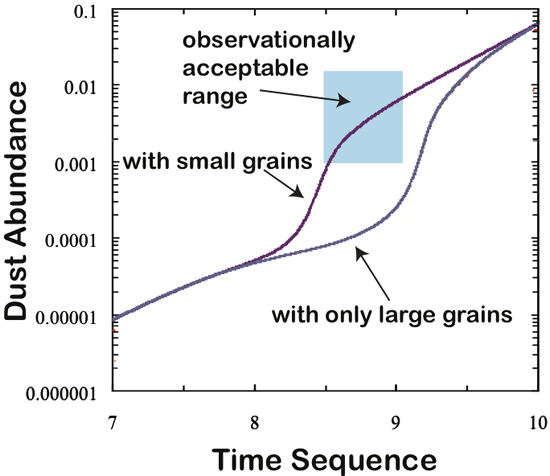
The evolution of dust abundance relative to the total gas content calculated by the theoretical models developed by Tzu-Ming Kuo and me (Kuo & Hirashita 2012, MNRAS, 432, 637). The horizontal axis shows the time sequence (precisely, the oxygen abundance 12+log(O/H)). The vertical axis show the dust abundance (dust-to-gas ratio). We examine two cases: without and with small (< 0.1 μm) dust grains. Without small grains (i.e., only with large grains), the rapid increase of dust abundance due to dust growth comes later, failing to explain the observationally acceptable range (blue box) for the distant quasars. With small grains, the rapid increase of the dust abundance by dust growth occurs earlier, and the line successfully pass through the observational range (blue box), which means that we can successfully explain the dust abundance observed in the quasars.
|