Research Gallery > Cosmology
Research Gallery
Cosmology
| Direct measurement of the angular power spectrum of cosmic microwave background temperature anisotropies in the WMAP Data |
|
Image Credit: Chiang and Chen

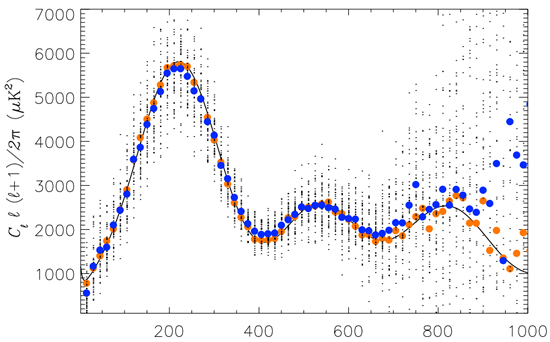
Direct measurement of the CMB angular power spectrum. From WMAP V band map we choose patches with σ < 98 μK (after eliminating bright point sources), and we take the cross-power spectra of patches between WMAP V and W band. After deconvolution of the window functions, the power spectra of the 47 patches are shown in black dot and the mean power spectrum is in big blue dot. For comparison we plot in big orange dot the power spectrum binned (⊿l = 15) from that by the WMAP science team. The best-fit CDM model is in solid line.
|
| Angular power spectrum of the cosmic microwave background (CMB) temperature anisotropies is one of the most important on characteristics of the Universe such as its geometry and total density. Lung-Yih Chiang and Fei-Fan Chen (Chiang & Chen, 2011, ApJ, 738, 188; ApJ submitted, arXiv:1108.5824) use flat-sky approximation and Fourier analysis, we estimate the angular power spectrum from an ensemble of least foreground-contaminated square patches from WMAP W and V frequency band map. This method circumvents the issue of foreground cleaning and that of breaking orthogonality in spherical harmonic analysis due to masking out the bright Galactic plane region, thereby rendering a direct measurement of the angular power spectrum. The patches are chosen with the criterion on the variance of the temperature anisotropies. The lower the variance, the less
the foreground contaminated in the patch. We test and confirm Gaussian statistical characteristic of the selected patches, from which the first and second acoustic peak of the power spectrum are reproduced, and the third
peak is clearly visible albeit with some noise residual at the tail. |
 asiaa.sinica.edu.tw Media Request: epo
 asiaa.sinica.edu.tw
