
Research Gallery > Planetary Sciences
Research Gallery
Planetary Sciences
| Spectral energy distribution |
|
Image Credit: J.P. Marshall
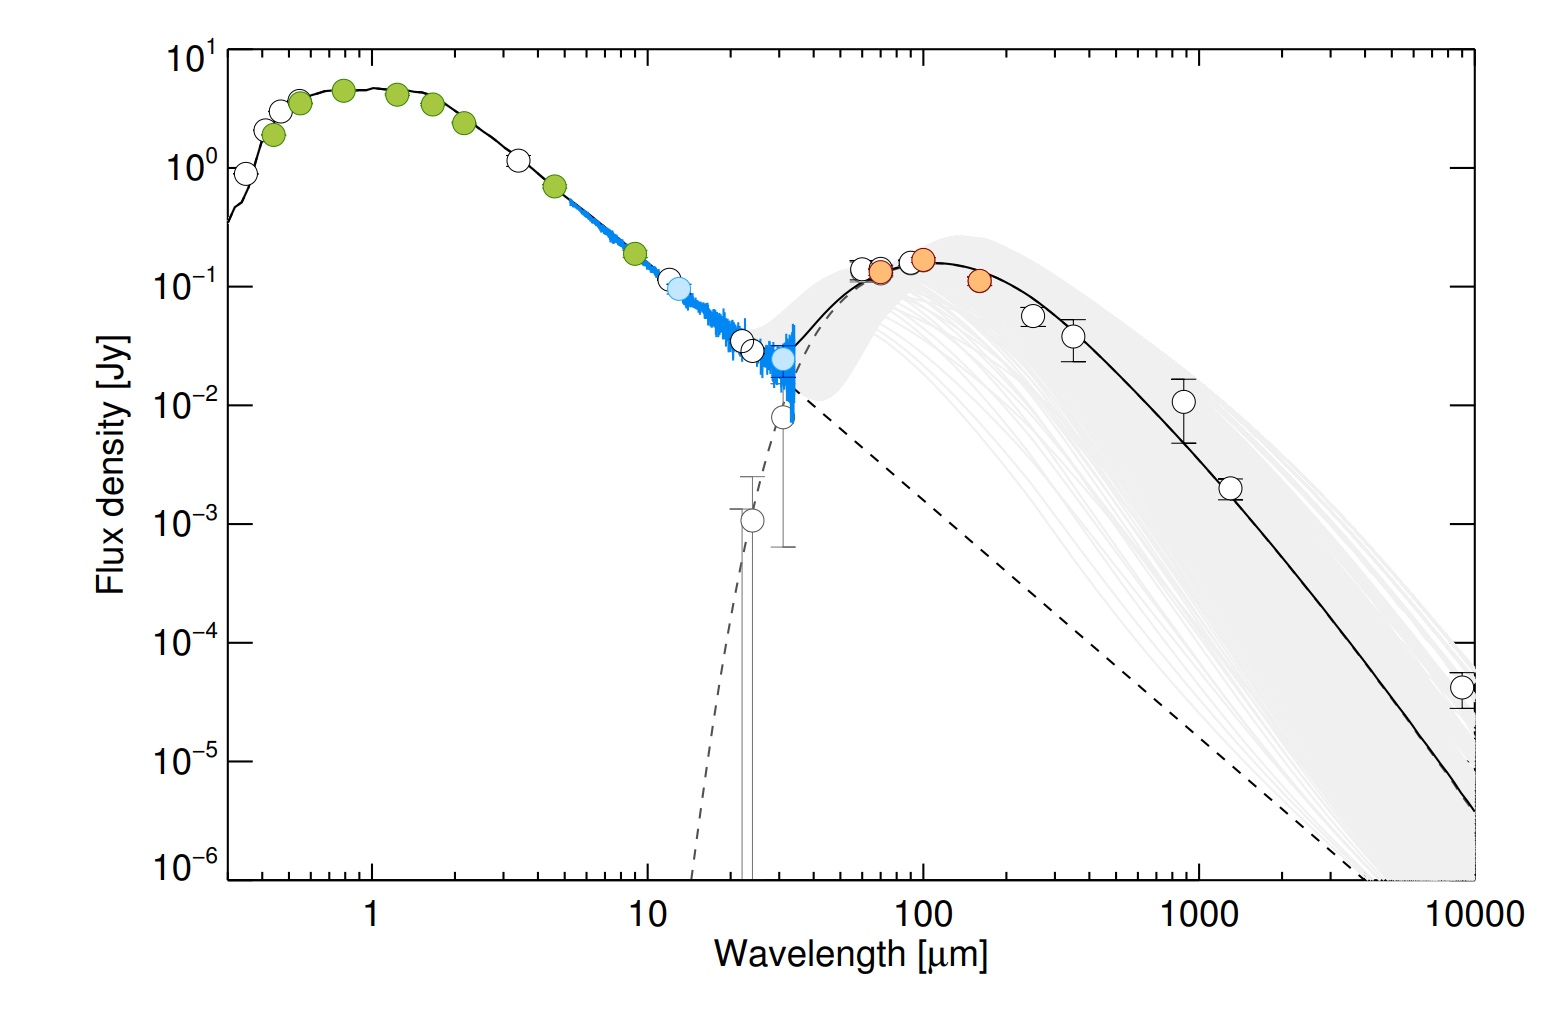
Spectral energy distribution (wavelength vs. flux density) of the debris disc host star HD 105. Data points are coloured by wavelength regime: green for optical/near-infrared, blue for mid-infrared (including the Spitzer/IRS spectrum), and red for far-infrared (Herschel/PACS). White data points are ancilliary data, including ALMA 1.3mm and ATCA 9mm observations. Grey lines denote a grid of dust models (grain size and distribution) fitted to the data to determine the best-fit dust properties for the system.
|